Reporting environmental data can feel a lot like the “old days” in so many ways. Regardless of improvements in instrument technology, the data and reporting requirements don’t change. What has changed though is the potential to make the data flow automatically into your regular reporting. That’s right, flow. Automatically.
“But I’ve got a routine I can do in my sleep.”
Yes, a lot of us have a comfortable ritual of importing regular monthly data to be cut and paste into monthly reports. Consider the quality costs though any time the “routine” is interrupted. A quick hello from a co-worker, the infectious laugh of your funniest cube mate, or simply your boss walking by and making eye contact. All are distractions. Brain researchers assert that it takes just three seconds of interruption for us to lose our focus. Suddenly last month’s data remains in place of this month’s. And that footer we had to update … well, we lost track of that.
Automation not only increases quality, but also saves time and money. The effort spent initially setting up the automated process is easily recouped. If those things were not enough, we also gain flexibility. So your regular report now has a new format, font size, or organization? With automation in place, you can easily respond to these new requirements. Compliant retroactive reports are also a no-brainer.
OK, Ok, ok … what are the cons?
Glad you asked. You’ll need tools + knowledge, which do take time and effort. The great news, though, is that the tools we’ll discuss here are open source. Meaning they are at no cost yet remarkably rich in resources. One thing the open source community despises is reinvented wheels, meaning code snippets are at your disposal for recycling. This wonderful quirk can save you hours of work, letting you spend time customizing your automation and not just building it from scratch.
Walk me through this …
In the following fictional desert, we’re tracking data from a network of particulate matter and meteorological sensors that have been uploaded to a database. Data must first undergo rigorous quality control to produce a meticulous, automated report. With the verified data ready for delivery, the next step is preparing a clear, comprehensive report — the client-facing deliverable.
Lay the groundwork
Automated reports are based on scripts. We use R, an open source statistical scripting language, for data import, summary, and analysis. R can also create maps, plot data, import and display images, and gather your data into formatted tables. Automation doesn’t have to mean loss of flexibility! With the proper setup, you can efficiently incorporate custom text blocks or sections.
Beyond code, readable for humans
To make your data digestible, it has to be transformed into a human-readable output. We write the skeleton for our reports using R Markdown, a rich markdown language designed to produce good-looking, readable documents that can integrate data from many sources. Once your markdown document is ready, join it with your analysis results into an output document with KNITR. In our example, we first rendered in Hypertext Markup Language (HTML) to take advantage of the wide range of available formatting options. We then used wkhtmltopdf, an open source command line tool, to convert the HTML document into a PDF.
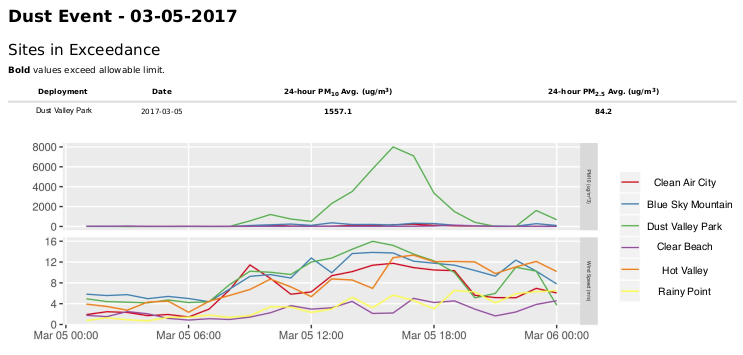
A visually compelling and automated report based on data previously controlled for quality. Click here to view the complete four-page mock-up.
Optimization — saying no to bloat
The last step in this process is shrinking the file size as best as possible. Not only is it considerate, but it’s also a best practice. We sucked the bloat out of this report by using the compression options available in the tool ghostscript.
The final product is a visually appealing, informative report in a universal format that can be easily distributed. And best of all, it was produced (and can easily be reproduced) without hours of time-consuming manual editing!
This is great, but …
Like what you’ve read but just don’t want to tackle the task? No worries. Air Sciences Inc. is committed to helping you get a handle on quality while saving you money and time. Contact us to learn more about how we can help you set up automation for your environmental data reporting.
