Click Here to Access the AEREarth Tool
AEREarth is a practical tool for those involved in air quality permitting and compliance. The tool can handle very large data sets and all source types (point, line, area, volume, and pit), and it considers release heights and stack heights. AEREarth also uses absolute elevations rather than relative elevations.
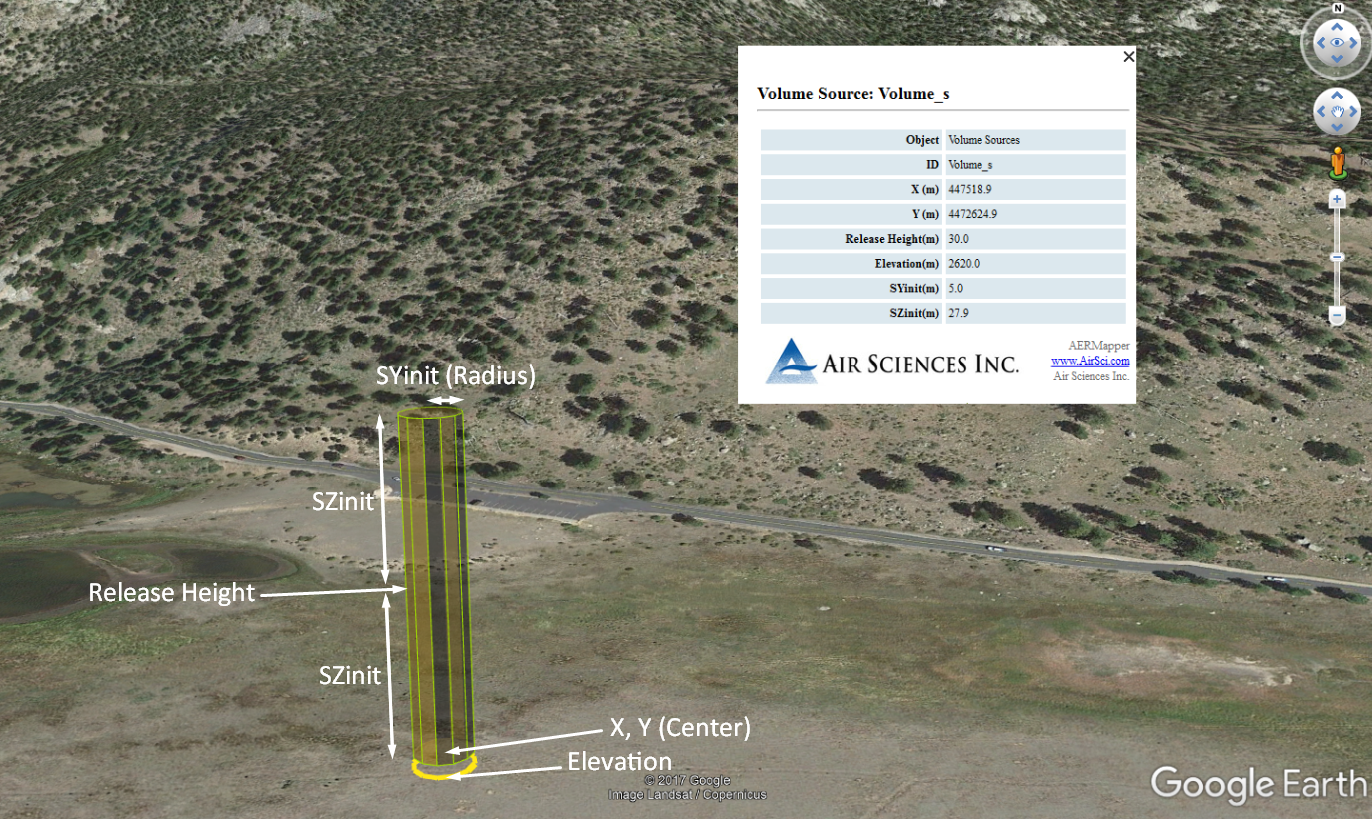
AEREarth Example: AERMOD Volume Source Visualization
Software such as Lakes Environmental also generates 3D mapping software files that are viewable through Google Earth to visually display model runs. However, these require a software license. In addition, these software packages use relative elevations (or ignore elevation altogether), which makes it difficult to gauge correct elevations for source types. Absolute elevation is used inside the AERMOD model, so it is crucial to be able to quickly and visually tell if the input data includes the correct elevation. In the Lakes Environmental software, for example, there is no easy visual way to perform QA checks on elevations. AEREarth allows a quick and easy way to audit AERMOD input data files before spending time running potentially erroneous input data files.

AEREarth Example: AERMOD Point Source Visualization
In addition to correctly handling elevation, AEREarth has customized source shape and attribute data to allow you to access all of the source parameters, and correctly visualize complicated volume sources such as haul roads.
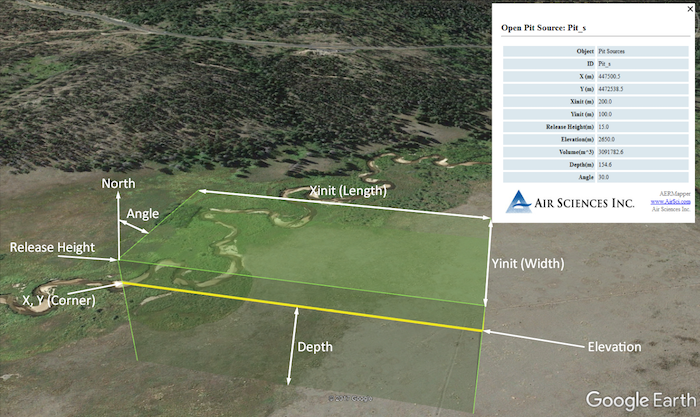
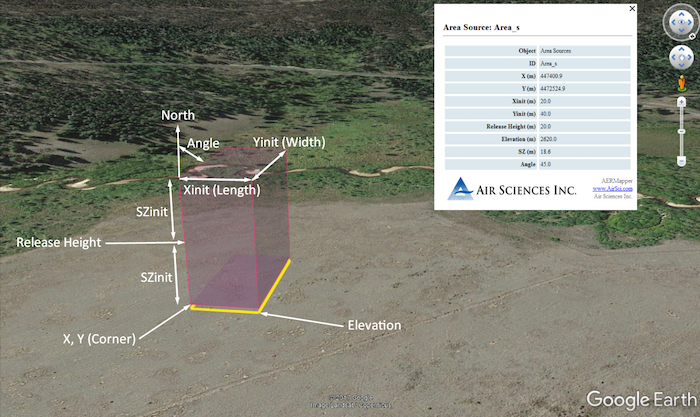
AEREarth Example: AERMOD Open Pit Source Visualization
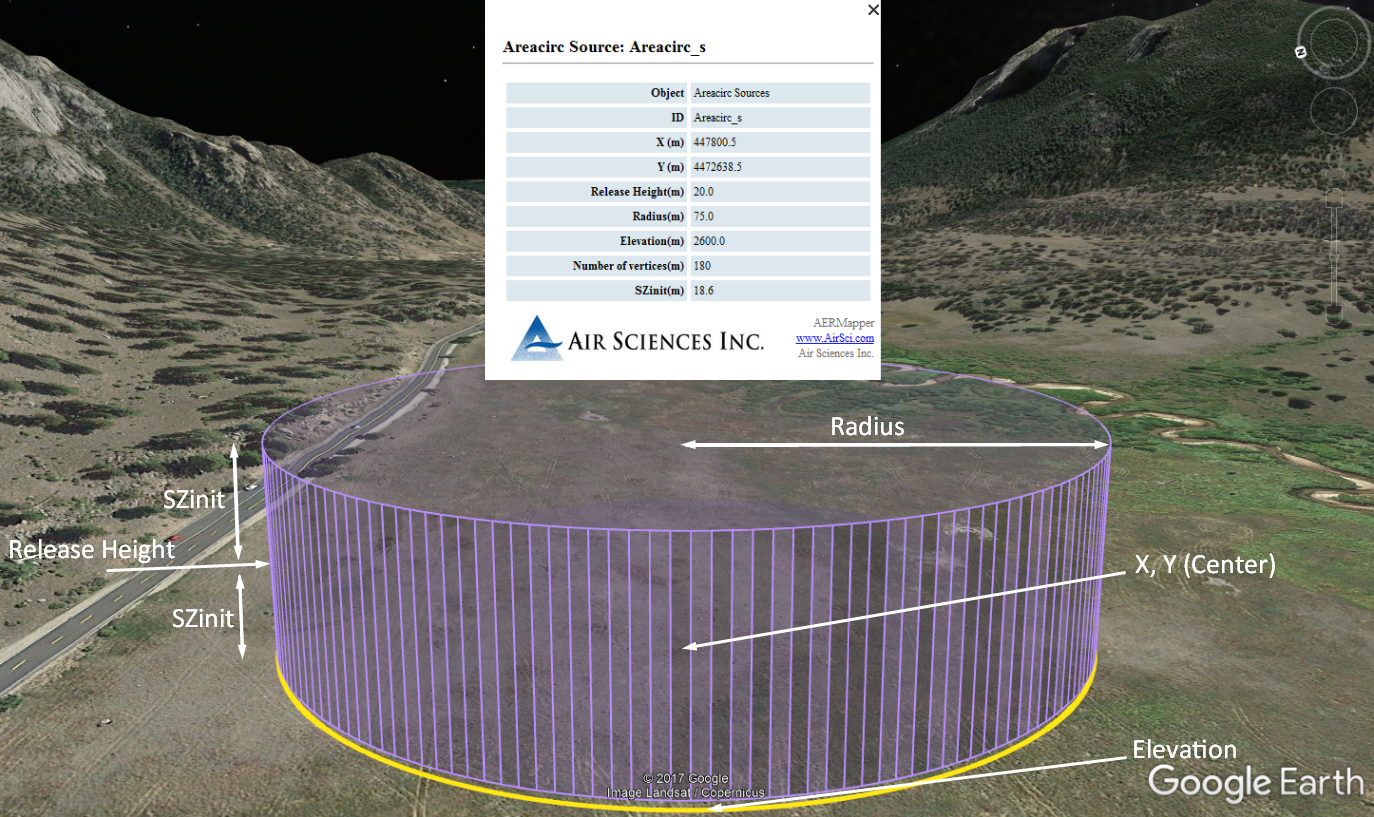
AEREarth Example: AERMOD Areacirc Source Visualization
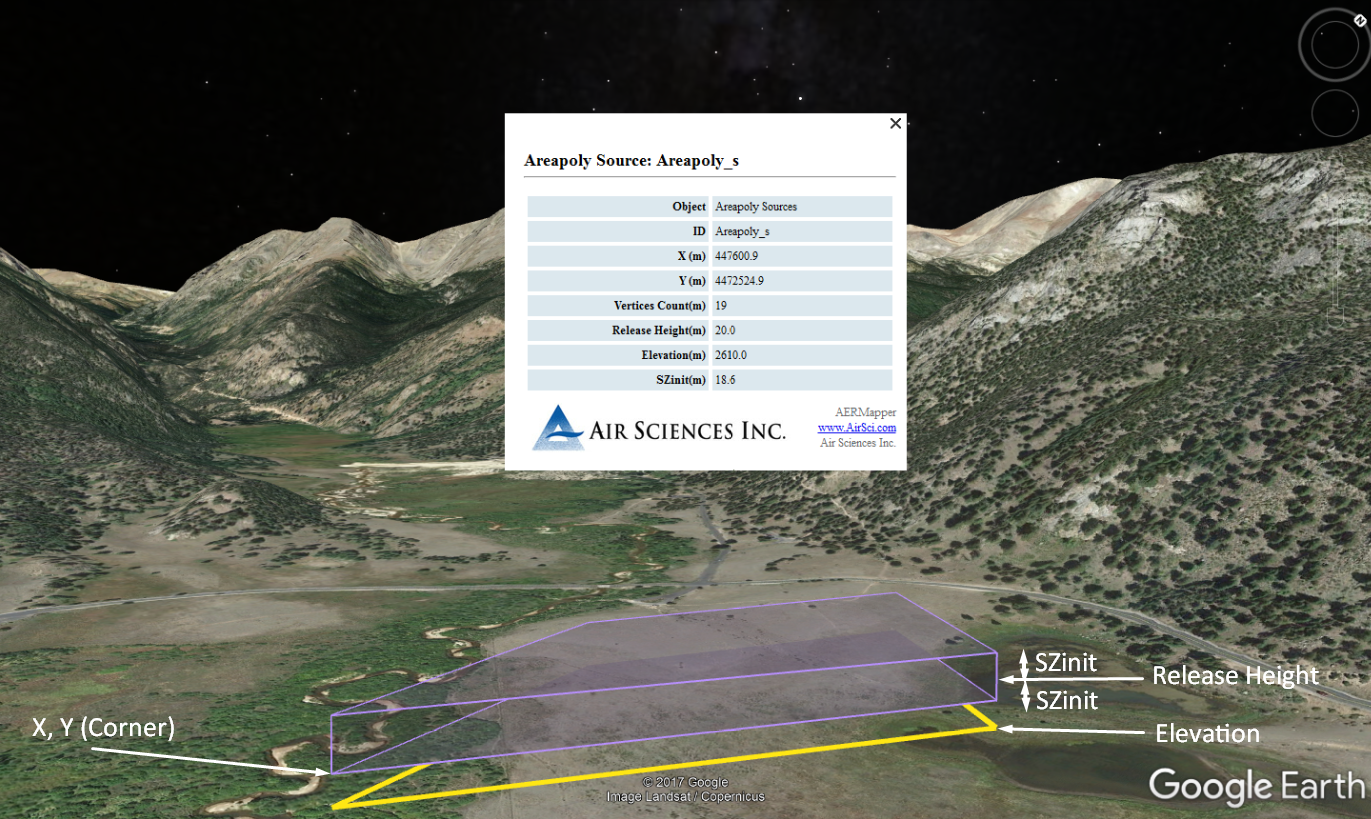
AEREarth Example: AERMOD Areapoly Source Visualization

AEREarth Example: AERMOD Line Source Visualization
To use AEREarth, click the link below. Then, upload an AERMOD input data file (.inp, .api, .ppp, .pip, or .bpi) and enter the UTM zone and number; a set of KML files will download automatically.
Click Here to Access the AEREarth Tool
Comment below and let us know what you think!
