We recently wrote a post about a handy Excel workbook you can use to query elevations for a set of coordinates in the Google Maps Application Programming Interface (API). Here, we’ll go over how to do the same thing using Python.
This post assumes you have some working knowledge of scripting, and introduces some very powerful, open-source tools for manipulating spatial data. To run the code below, you’ll first need to set up your Python environment, which for this example uses the following:
Python 3.8
geopandas==0.9.0
shapely==1.7.1
matplotlib==3.4.0
requests==2.25.1
So let’s set up everything we’ll need to make a request to the API, including importing the packages, defining request strings, and sourcing input data. You’ll need to paste in your own API key, which you can set up by following these instructions.
import matplotlib.pyplot as plt
import geopandas as gpd
import requests
from shapely.geometry import Point
from os.path import join as pth_join
import json
import time

#Configure API request link
url_root = "https://maps.googleapis.com/maps/api/elevation"
key_str = "GFVerAfCoyBsdfPD7nnW8QQC7ZZt5ytKiCO4e3Zu"
output_fmt = "json"
request_str = "%s/%s?locations=%s&key=%s"

#Define data inputs and outputs
data_root = "/Users/airsci/git/wrap-cmfd/CM_data"
input_file = "wrap_oregon_odf_clean.shp"
output_file = input_file[:-4]+"_elev.shp"
Now that we have all of our constants configured, let’s get to work. First, we will load our input file (a shapefile of prescribed burn locations in Oregon) into a GeoDataFrame. Next, we have to reproject our dataset into WGS84, which is the geographic coordinate system used by the API.
#Read input file into a GeoDataFrame
gdf = gpd.read_file(pth_join(data_root,input_file))
gdf_wgs = gdf.to_crs("EPSG:4326")
Next, we use a lambda function to convert our point geometries into a series of strings. Note that to convert (x,y) notation to (latitude, longitude), longitude is your x.
#Extract x,y from geometry and convert to strings
build_str = gdf_wgs['geometry'].apply(lambda v: ("%s,%s|" % (str(v.y), str(v.x))))
Now, because the API limits each request to 512 point locations, we have to break apart our API requests into chunks and iterate. Each iteration builds a GET string and makes a request to the API. The iteration then adds to a list of Point geometry objects that represent our re-consolidated locations that now have elevations (in meters).
#Limit each request to 512
geom = []
iterations = int(len(build_str)/512) + 1
for x in range(iterations):
    iter_str = build_str[x*512:(x+1)*512]
    #Build concatenated string for API request
    locs = "".join([x for x in iter_str]).rstrip('|')

    #Make request, parse results
    r = requests.get(request_str % (url_root,output_fmt,locs,key_str))
    parsed = json.loads(r.text)

    #Extract elevations from result
    geom = geom + [Point(i['location']['lng'],i['location']
                         ['lat'],i['elevation']) for i in parsed['results']]

    #Slow down API requests so we aren't blocked
    time.sleep(1)
The last step is to export these new coordinates to a new shapefile, making sure we handle our projections correctly.
#Save to new file with x,y,z and reproject to CRS of input file
gdf_elev = gpd.GeoDataFrame({'geometry':geom},crs="EPSG:4326")
gdf_elev.to_crs(gdf.crs).to_file(pth_join(data_root,output_file))
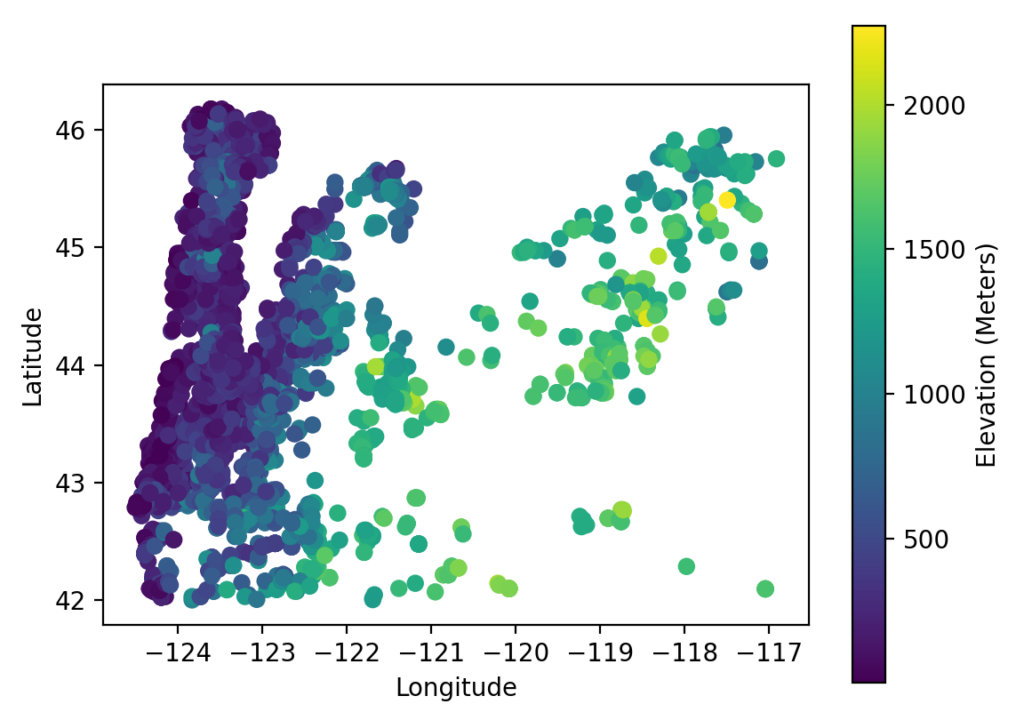
Just for fun, let’s check our work with a simple plot:
#Check results with a simple plot
gdf_elev['elevation'] = gdf_elev['geometry'].apply(lambda v: (v.z))
ax = gdf_elev.plot("elevation",legend=True,legend_kwds={'label': "Elevation (Meters)"})
ax.set_ylabel('Latitude')
ax.set_xlabel('Longitude')
plt.show()

Simple heat map of prescribed burn locations in the state of Oregon expressed in meters. Geographic coordinates are represented along the X axis (east-west) and Y axis (north-south).
In this brief example, we did not bother to carry forward any attributes that may be in the original input file and would likely require a spatial join. This is because you can’t assume the order of the data points will stay the same before and after the request, nor will the coordinates be precisely the same. We also did not incorporate error-checking into our request response. The API returns an ‘error’ key instead of ‘results’ when something goes wrong.
To dive deeper into the tools used here, see the documentation for GeoPandas (an extension of Pandas), matplotlib, and Shapely. Happy coding!
